
courtesy of Surface Measurement Systems Ltd
In the present paper dispersive surface energies and specific free energies have been calculated for different modified E-glass fibre surfaces. Both different sizing and different polymer coatings have been investigated to consider changes in the surface chemistry and surface energy during different fibre treatments.
Introduction
Inverse Gas Chromatography (IGC SEA) is a wellknown technique for the characterisation of industrial and natural fibres.
A good example for the application of IGC SEA in the characterisation of natural fibres is the determination of cotton/fragrance interactions described in [ ]. The current paper is dedicated to the characterisation of industrial fibres by IGC SEA. The most common measured materials in this area are carbon and glass fibres. An extensive description of the determination of carbon fibre properties is given in [ 2].
Glass fibres are a common industrial product and used, for instance, in the production of sounda and heat-insulation materials. Another key application is a reinforcement for composites. Thus, a study of the surface chemistry of glass fibres and fibre composites holds a high level of interest.
The use of common adsorption techniques is limited for this application since glass fibres have a relatively small surface area. IGC SEA, however, provides the required sensitivity to study surface adsorption and additional physico-chemical properties.
Theory
IGC SEA pulse experiments are carried out at infinite dilution conditions. In this concentration range molecular adsorption is independent of the
surface coverage and only interactions with the highest energy sites occur. Therefore eluted peaks are symmetrical and the retention volume
can be calculated from the retention time at the peak maximum. The net retention volumes VN are computed using Equation 1.

where T is the column temperature, m the sample mass, F is the exit flow rate at 1 atm and 273.15K, tR is the retention time for the
adsorbing probe and t0 is the mobile phase holdup time (dead time). j is the James-Martin correction, which corrects the retention time for
the pressure drop in the column bed. The relation between the retention volume and free energy of sorption ΔG is given by Equation 2.

where R is the gas constant and K is a constant depending on the chosen reference state (De Boer or Kemball/Rideal) Morever ΔG is
related to the energy of adhesion WA (between probe molecule and solid) by Equation 3 (as an approximation).

where α is the cross sectional area of the adsorbate and NA the Avogadro constant. According to Fowkes [1] the dispersive
contribution of the work of adhesion WA is given by Equation 5.

with Υs D and ΥL D as the surface tension of the adsorbent and the adsorbate respectively. Combining Equations 2, 3 and 5 leads to:
This is the most common model for the determination of the dispersive surface energy and the free energy [2].
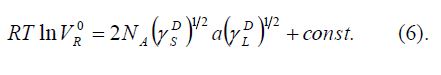
A theoretically more rigorous approach for the determination of the free energy uses a plot of RTlnV versus the polarisation PD [3], which is
calculated according to Equation 6.

where n is the refraction index, M the molar mass and φlq the liquid density of the probe molecule.
Method
Various columns were packed with E-glass fibres provided by Johns Manville and Imperial College,London. The packing of fibres was done as
follows: a bundle of fibres, about 70 cm in length was bent in the middle. A thin metal wire was wrapped around the eye in the middle and then
pulled through a standard glass column with a 4 mm internal diameter. Both ends were cut and was bent in the middle. A thin metal wire was
wrapped around the eye in the middle and then pulled through a standard glass column with a 4mm internal diameter. Both ends were cut and
the mass of the sample could be determined by comparing the weights of the empty and filled column.
All sorption experiments were carried out on an SMS-iGC 2000. Measurements were performed with various alkanes and polar probe molecules,
all supplied by Aldrich. Prior to these measurements, the samples were pre-treated for 3 h at 373 K to remove impurities adsorbed on the surface.
For the sized fibres pre-treatment was also carried out at 313 K, 343 K and 413 K to investigate the effect of pre-treatment temperature on the results.
After the pre-treatment procedure pulse injections were performed by a 0.25 ml gas loop at 303 K.
Results
Two different sets of glass fibres were investigated. The first set represents three different E-glass fibres (Johns-Manville), one untreated and the other two sized with A1100
(silane) and A187 (silane). Surface energies and free energies have been determined. The pre-treatment temperature was also varied to study its effect on the results. This
is shown in Figure 1.

The graph shows that from 373 K (100 °C) onwards the change in the surface energy is relatively small. Therefore 373 K was used for all experiments as the pre-treatment temperature.
Figure 2 shows the dispersive surface energy for the first set of fibres (different sizings). The dispersive surface energy was determined by pulse injections of a row of alkanes (heptane-undecane).

Uncoated E-glass shows the lowest surface energy (36.56 mJ/m2) while A187 (39.58 mJ/m2) and A1100 (39.39 mJ/m2) have significantly higher surface energies.
The differences between A187 and A1100 are within the experimental error margin (<3 %).
The specific free energy of desorption was analysed using the polarisation approach [3]. As indicated in Figure 3, dichloromethane shows a similar pattern to the dispersive surface energy
whereas the other polar probes behave differently.

Although 1-butanol, a hydrophilic acid, displays the strongest interaction with the surface it is not a very selective probe molecule in this case since its interaction doesn’t change significantly for the different samples. This indicates only a weak impact of sizing on the hydrophilic-basic sites on the surface. The interaction with DCM, however, which is hydrophobic and acidic seems to increase for both sizings. This indicates an increase in the basicity of the surface. Ethyl acetate, which is rather hydrophilic and basic and especially 1,4 dioxane (tends to be a hydrophobic and basic), show a decrease in the interaction with the surface after the sizing for the A1100 while the interaction with A187 seems to remain almost unchanged. This suggests again an increase in the basicity with sizing, especially in the case of the A1100. This agrees with the statement of Osmont and Schreiber [4] that bare E-glass fibres have a mildly acid character while sizing, especially with amino agents, makes the surface rather basic.
The second set of fibres consists of seven different E-glass fibres (Owens-Corning), one sized with A1100 and the others sized with A1100 and coated with different polymers as indicated in Table 1

Similarly to the surface energies, the coating causes an increase in the interaction with all polar probes. The exception is again the 3265, where values are nearly unchanged compared to the uncoated E-glass. Ethanol shows even a decrease in the interaction. Apparently the polyvinyl-acetate-ethylene coating has no significant impact on the acid-base interaction. The only considerable effect is a small increase in
the hydrophobicity which explains the small raise in the toluene values and the slight decrease in the acetone and ethanol numbers.
Ethyl acetate and acetone tend to behave hydrophilic and basic while ethanol is rather hydrohilic and acidic. However, all three probe molecules can also behave amphoterically under certain circumstances, making the interpretation more difficult. Nevertheless, it can be clearly seen that 40366 shows the biggest increase in the free energies for all probe molecules. In particular, the interaction with ethanol increases significantly, indicating a rather basic surface. In fact, 40366 represents a pure PMMA coating, which is known to be Lewis-basic [4]. Sample 71446 and 71482 are blends consisting of PS and PMMA. The free energies of both samples show a significant increase with acidic and basic probe molecules.
The increase of the acidity is very interesting since PS is considered to be basic. However, it is well know that blends can show properties different to those of their individual components. This might also explain the particularly enhanced dispersive surface energies.
Conclusion
IGC SEA was shown to be a useful tool for the characterization of surface properties of different sized and different polymer coated fibres. The acid-base measurements in particular provide a unique view of changes in the surface chemistry related to the different manufacturing processes. A consideration of the surface heterogeneity, by varying the concentration of the probe molecule, could complete the obtained picture.
Acknowledgement:
SMS would like to acknowledge the contributions of Frank Thielmann, Simone Reutenauer and Asa Barbar towards this paper and Dr. Jon Bauer at Johns Manville Inc., Denver, USA for supplying the sized fibres and for his helpful suggestions.
References
[1] Fowkes, F.M., Ind. Eng. Chem. 56 (1964), 40.
[2] Dorris, G.M. and Gray, D.G., J. Coll. Interf. Sci. 77 (1980), 353.
[3] Dong, S. et al, Chromatographia 28 (1989), 469.
[4] Osmont, E. and Schreiber, H.P., in “Inverse Gas Chromatography”, Chapter 17, edited by Lloyd, D.R., Ward, T.C. and Schreiber, H.P., ACS Symposium Series 391 (1989).
[5] Dorris, G.M. and Gray, D.G., J. Coll. Interf. Sci. 77 (1980), 353.
[6] Dong, S. et al, Chromatographia 28 (1989), 469.
[7] Osmont, E. and Schreiber, H.P., in “Inverse Gas Chromatography”, Chapter 17, edited by Lloyd, D.R., Ward, T.C. and Schreiber, H.P., ACS Symposium Series 391 (1989).